Unique Capabilities & Features of Authoring Client
The below list highlights some of the major capabilities we believe are unique to our JReview® Java Authoring Client - all of these are just built-in functionality out of the box. JReview (previously IReview) functionality has been developed over the past 29 years based on suggestions from many of the installed pharmaceutical and regulatory government customers – leading more and more to a comprehensive set of functionality targeted specifically to clinical research use by clinicians, data managers, QA, medical writers, etc. We have also launched a user friendly web called JReviewWeb, Click Here to learn more.

Feature Area
v14.2.0
x
x
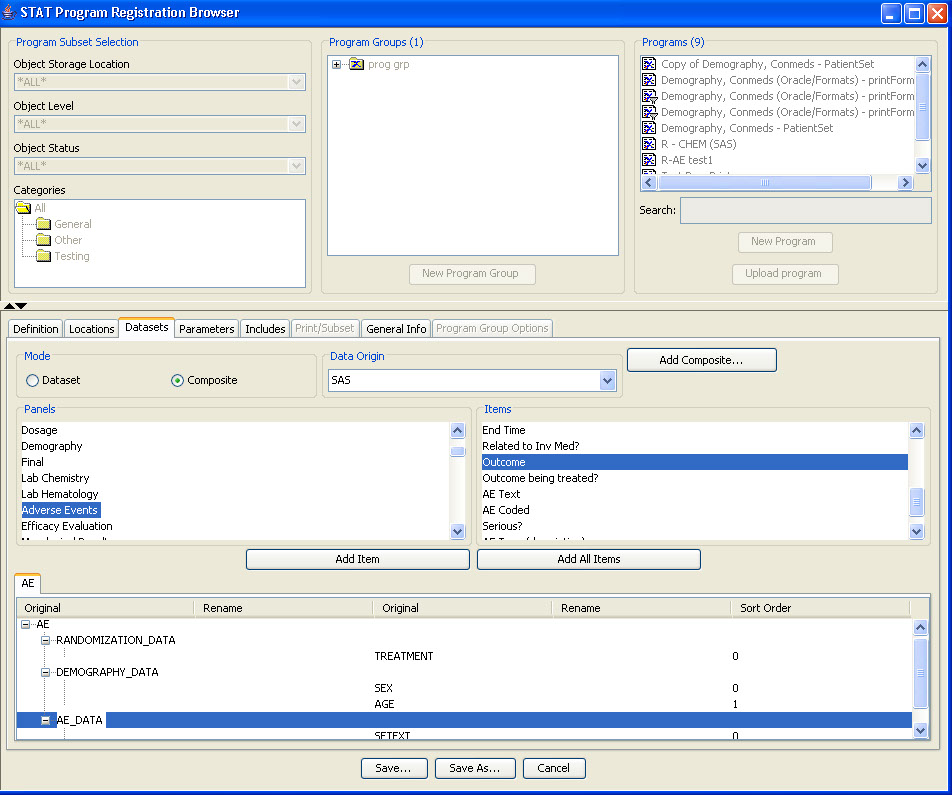
R Script Composites
JReview supports item name remapping, as well as forming R dataframe ‘composites’ – from different SAS datasets – where join logic has already been determined and implemented by JReview.
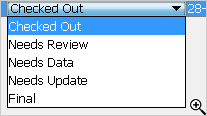
Narrative Status
After selecting patients to check out, each author maintains their own list of narratives to complete. Once a patient is checked out by one author, it is protected from being checked out by anyone else. After completion the author can submit a predefined status change like “Needs Review’ or “Needs more data” or “Final”, and return the patient back to the pool of patients in the checkout browser.
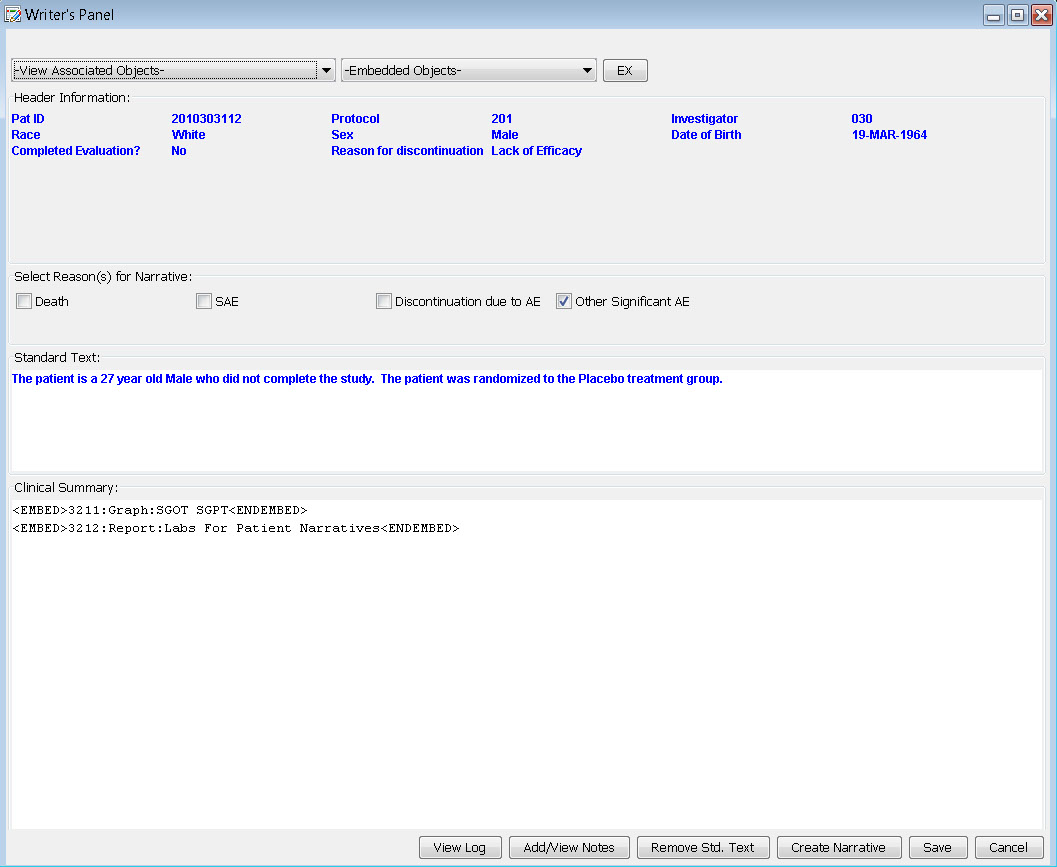
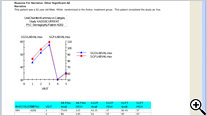
Writer's Panel
The narrative is auto-filled with header information and standard text. Based on information gleaned from predefined reports, notes, or patient profiles, the user can check the reason and write additional information in the clinical summary. Also, JReview defined graphs or reports to support the narrative can be embedded by the writer. Any notes that might be useful to the data collection process can be added from here as well.
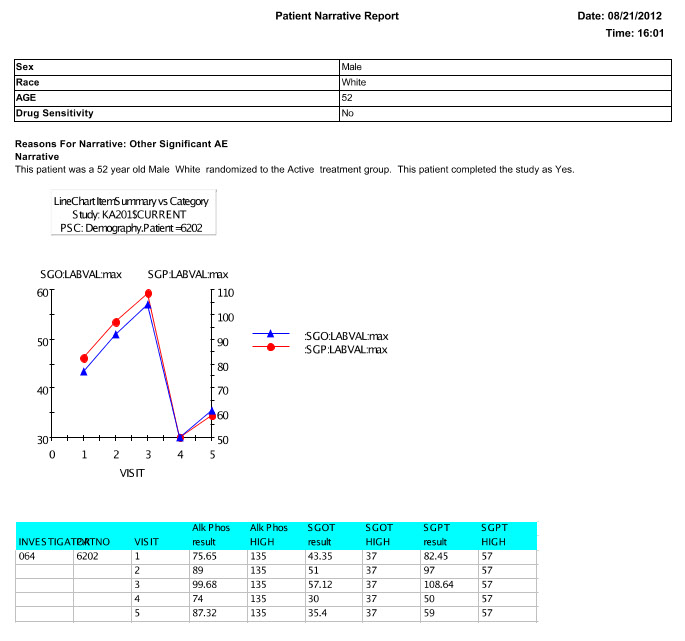
Patient Narrative
The narrative can be saved to the database, or saved as a pdf or rtf , and viewed by the writer. Future enhancements to patient narratives include working with the FDA to provide an export in a specific XML feed to help support data standards for use in FDA review.
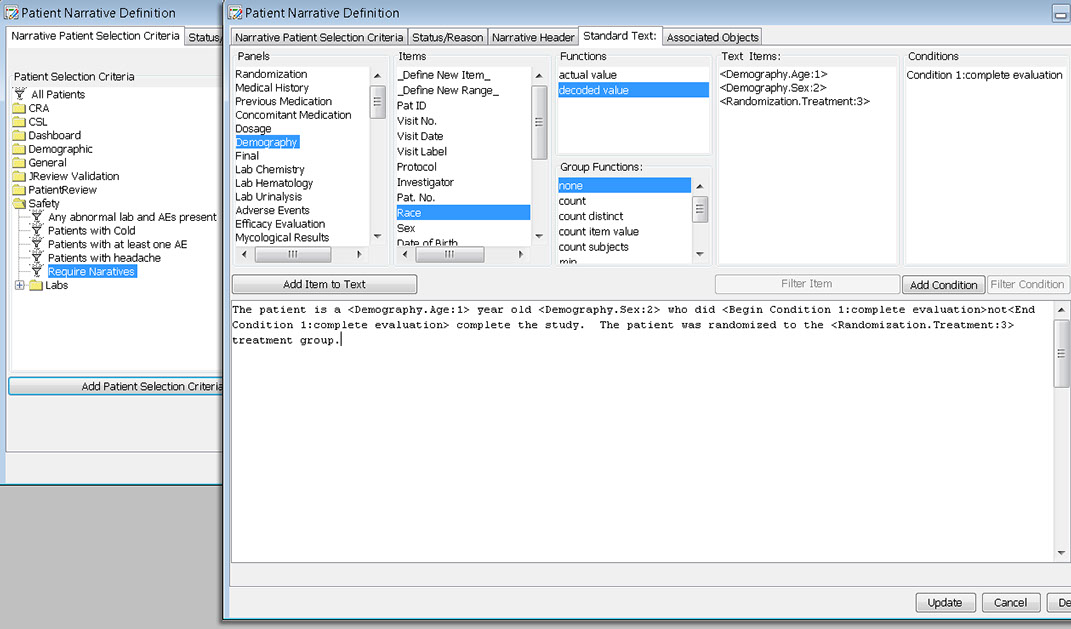
Narrative Definition
During the template definition process, the patients who need to have narratives written and the standard information in the narrative are predefined once per study or group of studies. The status types and reasons for narratives, standard header and text with conditional logic, and any embedded or associated objects are defined according to company preferences.
x
x
x

x
SAS data access
IRServer access SAS datasets via SAS Share directly for very high performance, and awareness of SAS Format Libraries by JReview.
To the top ↑
Ad hoc SAS analysis
Perform Ad hoc SAS analyses from within JReview environment which writes the SAS program and executes it for the user using SAS.
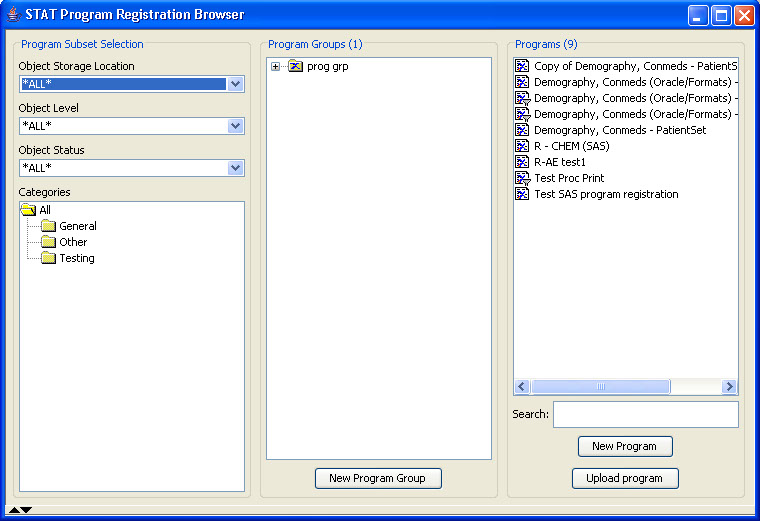
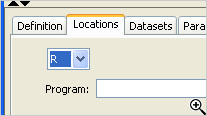
Register R Scripts
Ability to register any R scripts stored on the server side – to be executed from any JReview user’s session thereafter.
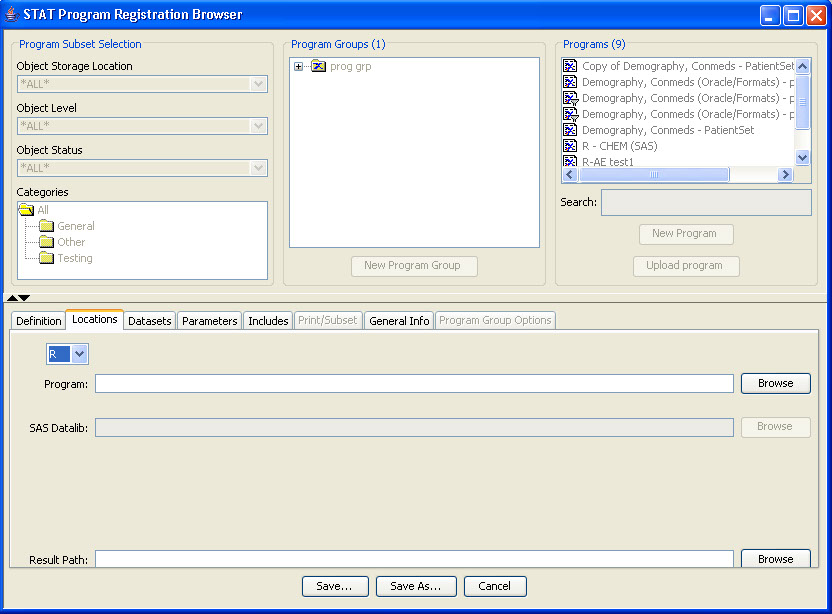
Execute your own SAS programs
Supports the ability to launch customer written SAS programs from within JReview environment.
x
x
x
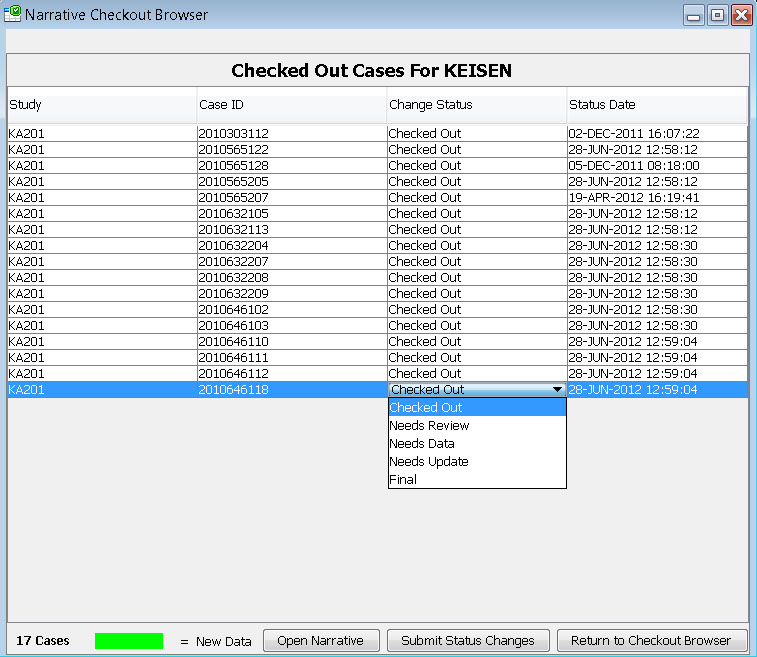
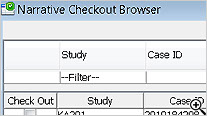
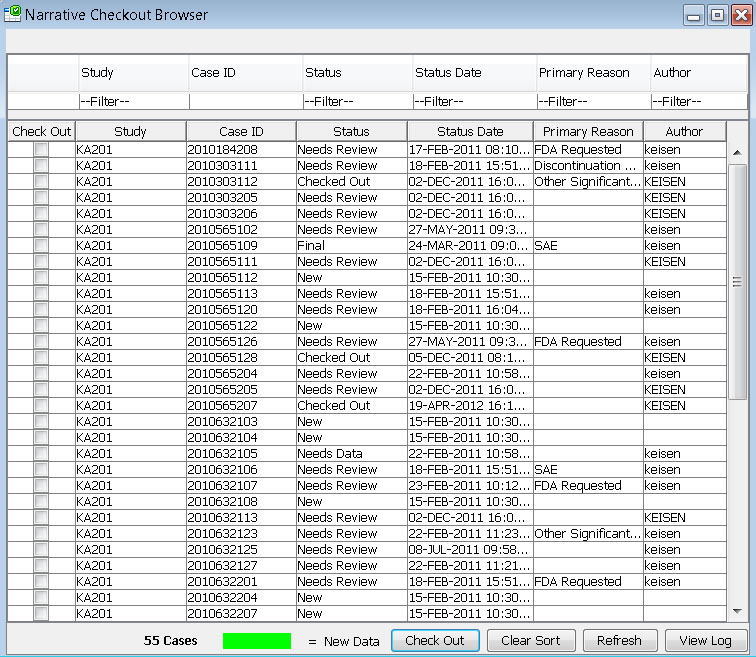
Narrative Checkout Browser
The narrative checkout browser contains a list of patients who require a narrative based on the predefined patient selection criteria in accordance with FDA requirements. This browser allows narrative authors to checkout patients in order to complete narratives, or can be used by reviewers to choose patients to view already completed narratives. This list can be filtered and sorted.
x
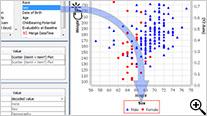
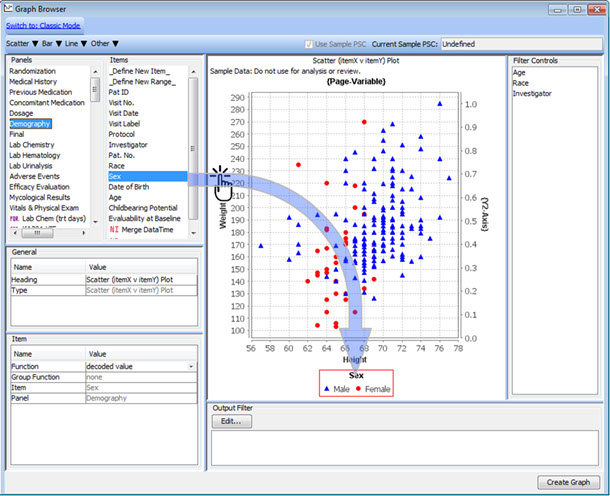
Drag & Drop Definition with Preview
To define a new graph - just drag panel items onto the graph window to set axes and by-variables, or to add legends and dynamic filter elements for safety experts to define patient characteristics.
This interactive preview mode lets you see the graph as you add these definitions - previewing the results on a subset of data in real time.
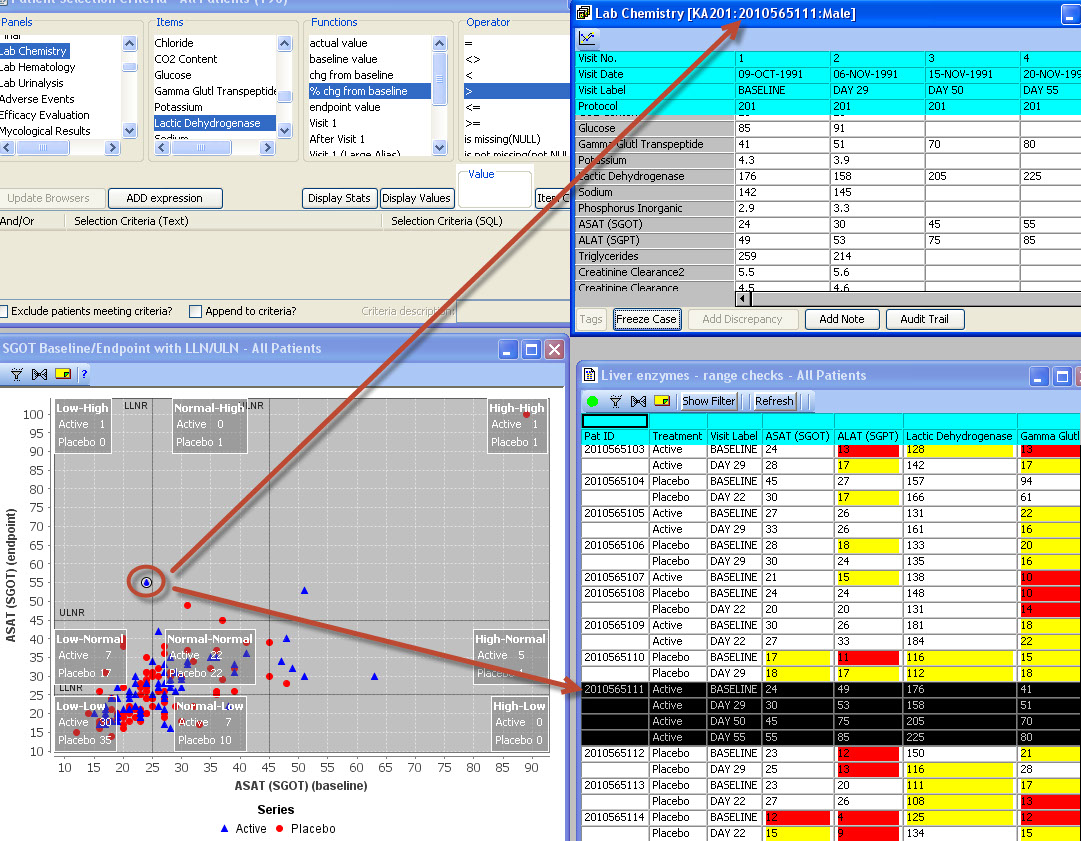
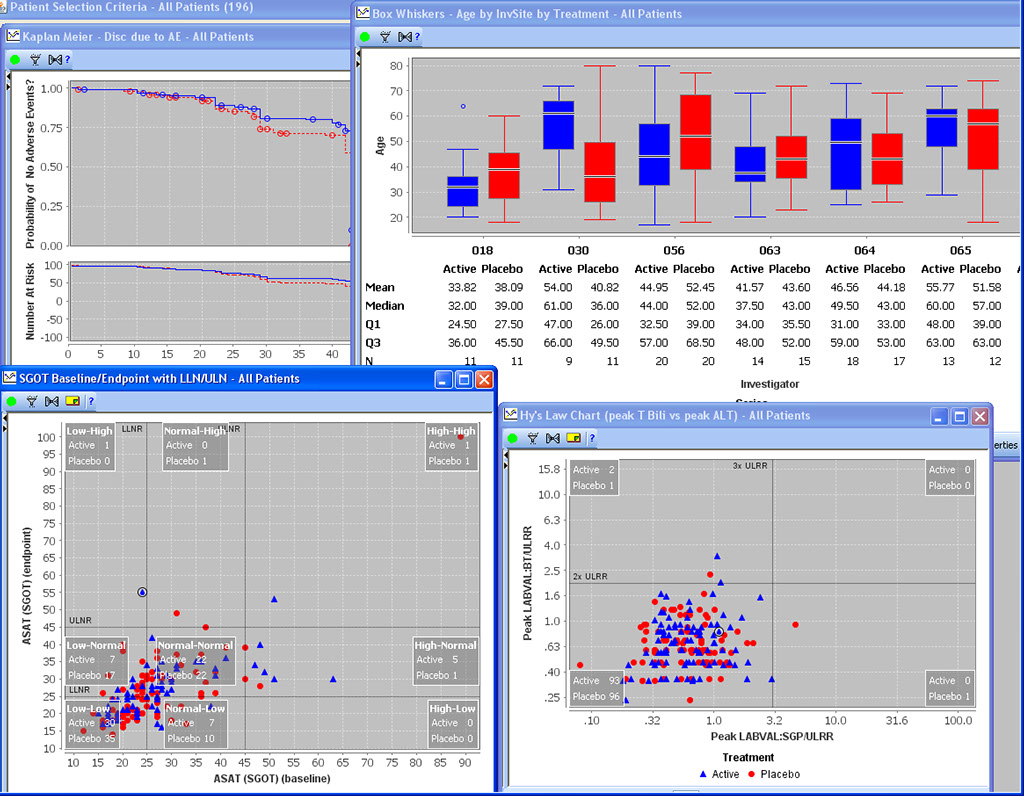
Special Graph types for Clinical Data
Baseline/Endpoint plots, Shift Plots, Hy’s Law Plots, and many more scientific, clinically relevant graph types for clinical data visualization are supported with patient identification built in. There is no need to setup any drill down rules for patient drill down as patient identification is native to JReview.
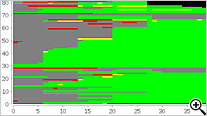
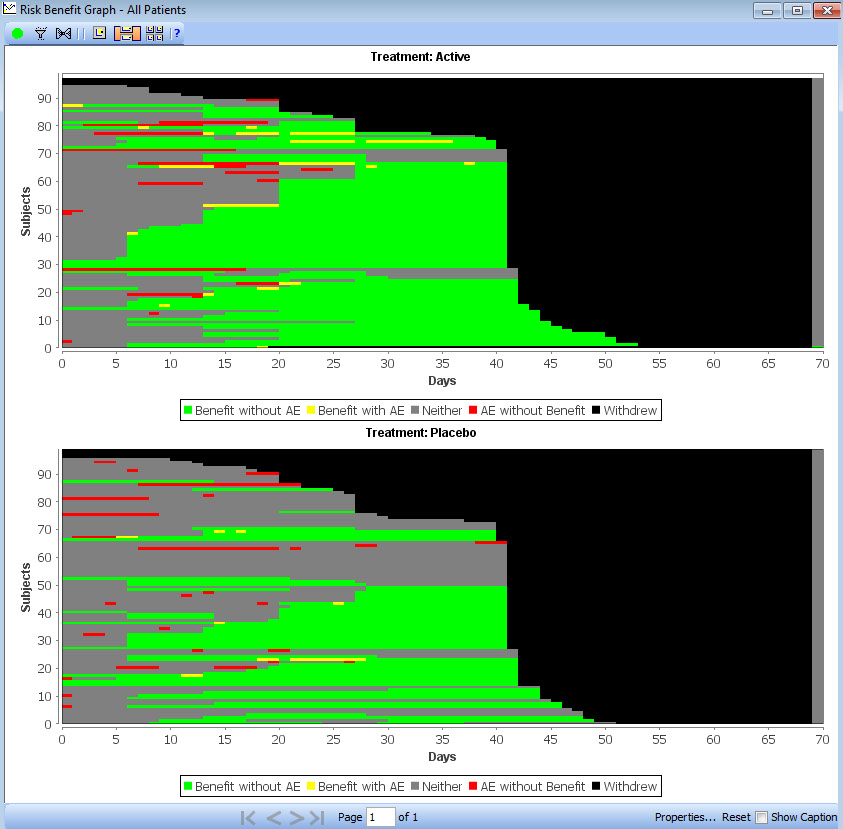
Benefit Risk Analysis
New graph type added at the request of the FDA based on design by FDA statistician (Jonathan Norton). A high level overview of benefit and risk of the trial is presented as a whole, displaying each patient as a row with color coded segments based on time period categorization for benefit, risk, both, neither or withdrawal.
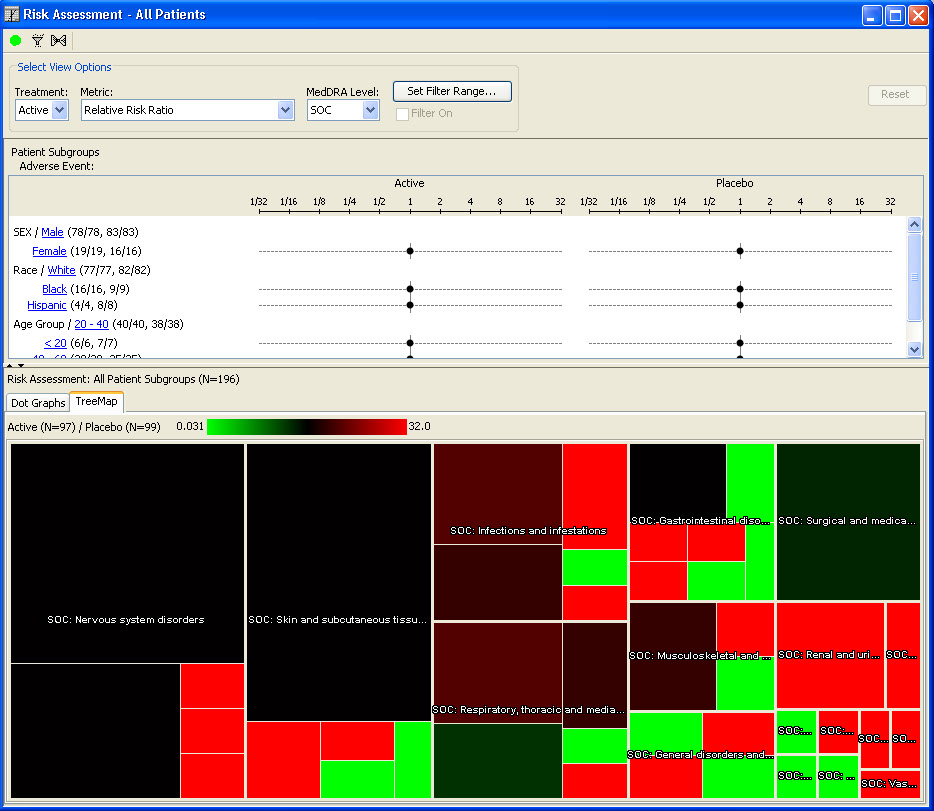
AE Risk Assessment – Tree Map
This AE Risk Assessment area was developed with the FDA and also provides ’forest plots’/’tree-map’ display of AEs organized by SOC, then PT within the tree-map. Each segment in the tree-map is interactive and clicking on any of the sections of interest highlights the patients represented in the section in any other patient level output.
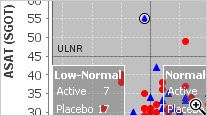
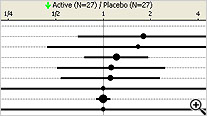
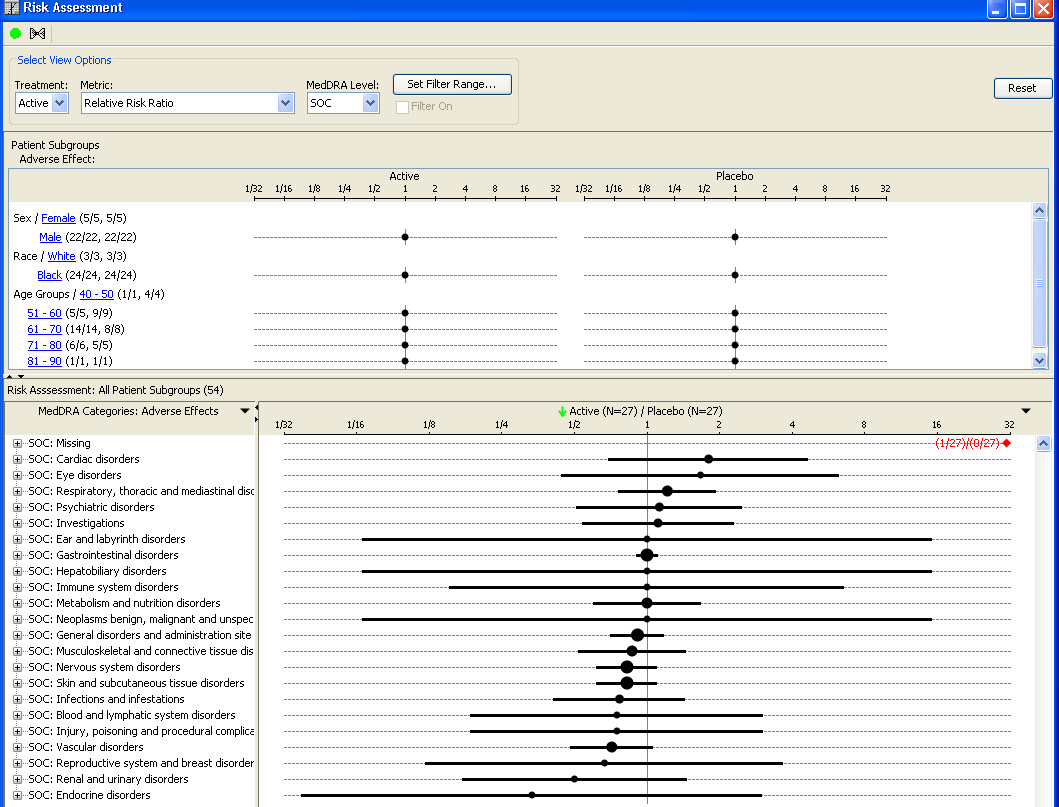
AE Risk Assessment - Dot Plots
This AE Risk Assessment area was developed with the FDA and provides interactive ‘dot plots’ with Patient Subgroup distribution analysis, as well the usual JReview patient identification features with other output displays.
x
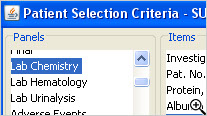
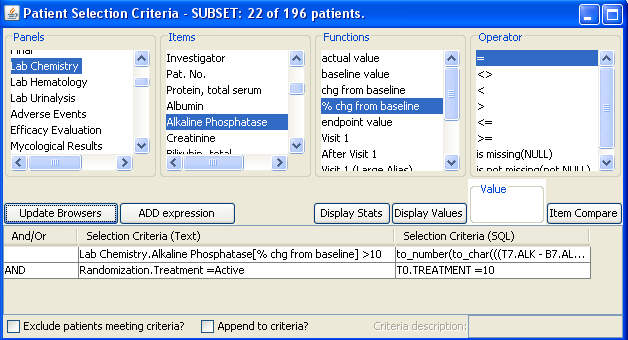
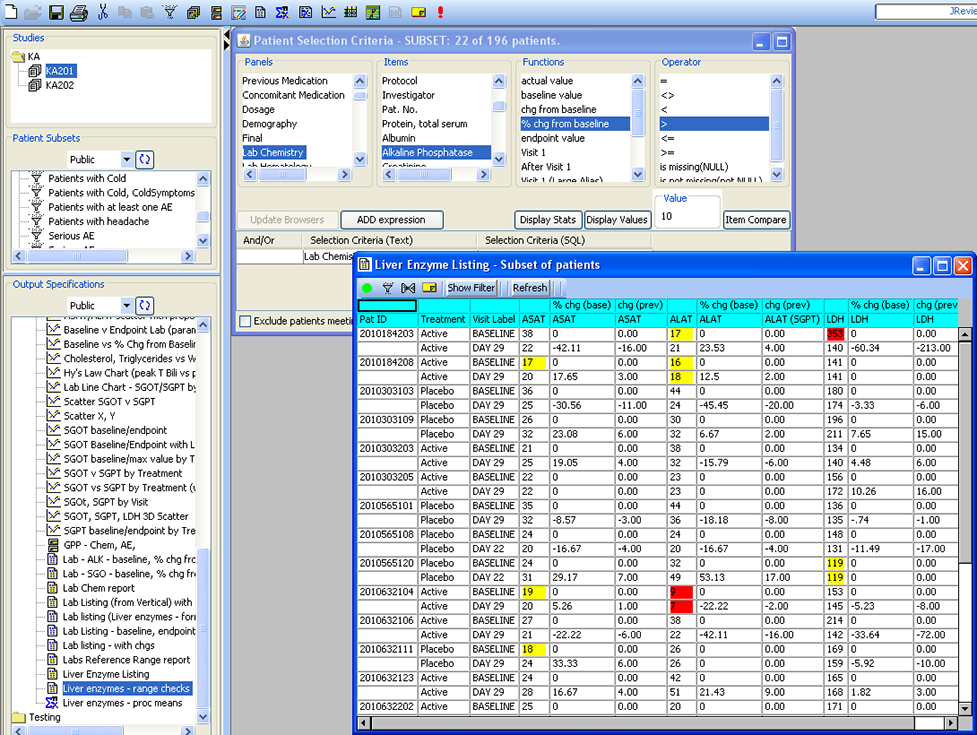
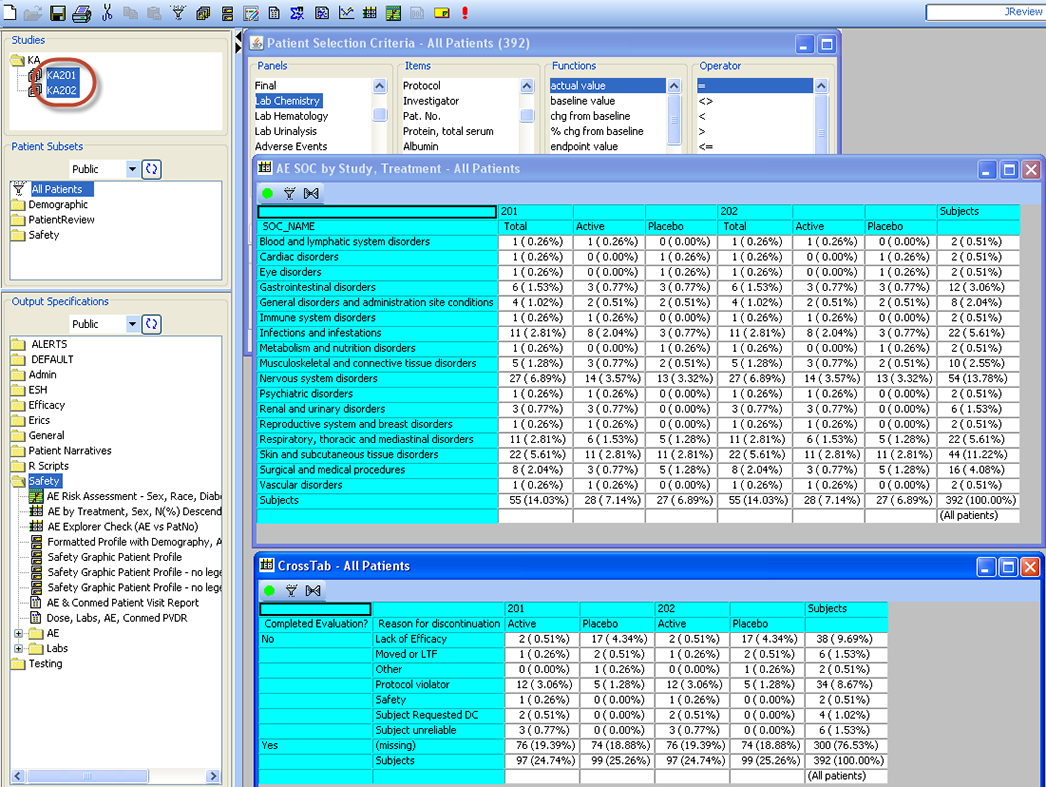
Patient Selection Criteria
Users can select any items from any table/dataset in the study, to use as part of the criteria for including or excluding entire patients into any displayed reports, graphs, patient profiles, etc.
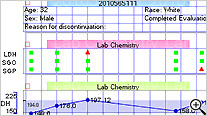
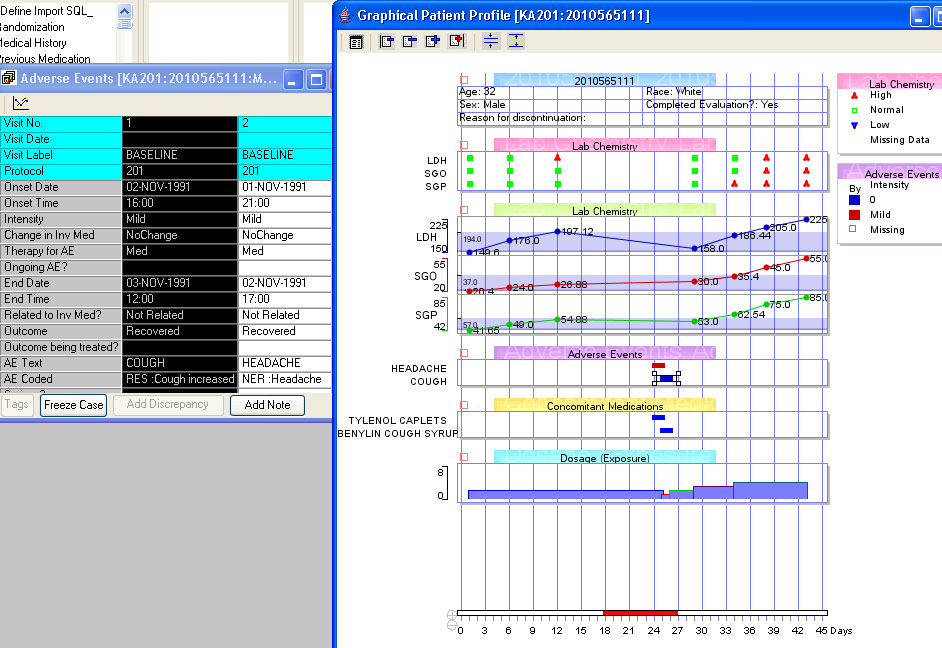
Graphical Patient Profiles
Time-oriented (days on drug) graph display of user selected parameters taken directly from database items. Users can choose which categories and items they’d like to include – on the fly - without going back to a programmer or other support personnel. Select a value and Drilldown to selected data of interest.
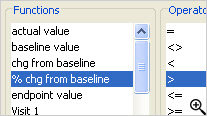
Awareness of Baseline & Endpoint
JReview knows about patient’s baseline, endpoint, or any time-related event and allows users to select patients based on these functions to report or graph these events, for example patients with 10% elevation of LDH from baseline.
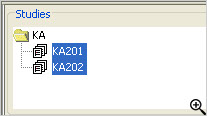
Dynamic Multi Study Pooling
across Projects
JReview provides a built in capability of dynamically pooling multiple studies, even across projects - just by multi-selecting each study of interest using the usual Windows convention of Shift or CTRL + mouse click. Then, any of the reports, graphs, etc. will run against the pooled set of study data. No data moving or copying of data is needed as it happens automatically and on the fly.
General
x
Patient Profiles
x
x
x
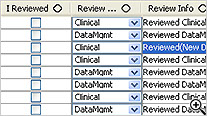
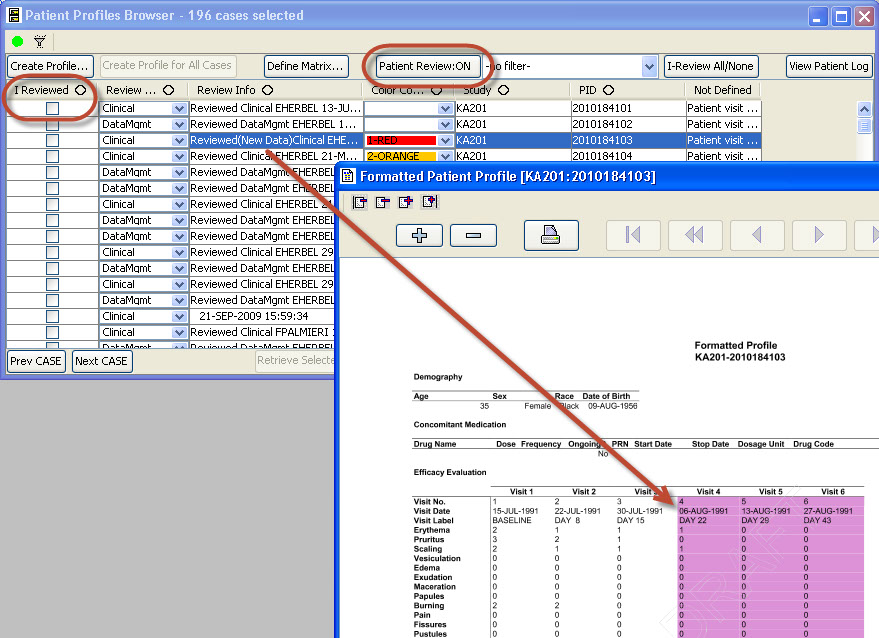
Patient Review Tracking ‘workflow’
As users are reviewing patient data, they can check the ‘I Reviewed’ checkbox so the system keeps track of which patients have been reviewed and by what department/function. The user may apply Color codes and comments to patients. JReview can display review status for all patients, as well as display highlighted rows in the patient profile when new data is received since it was last reviewed.
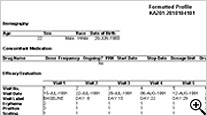
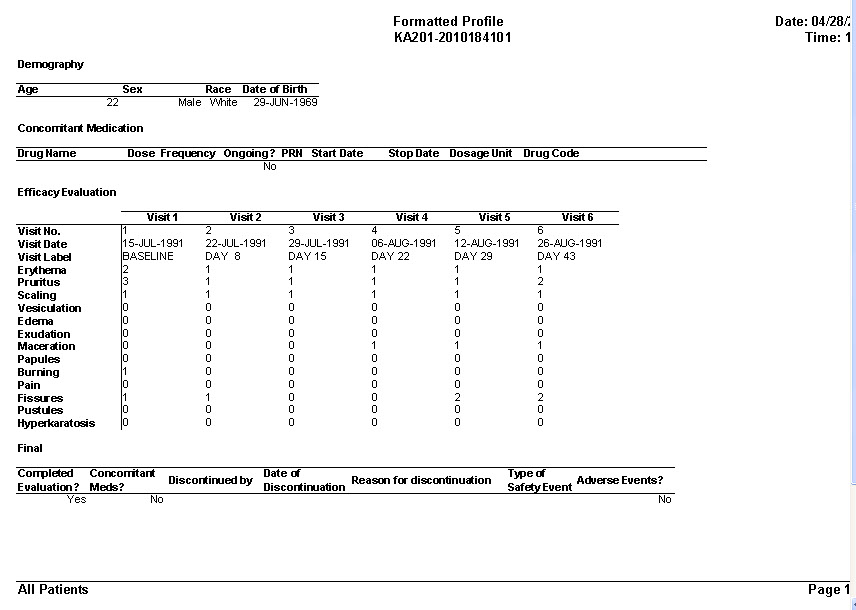
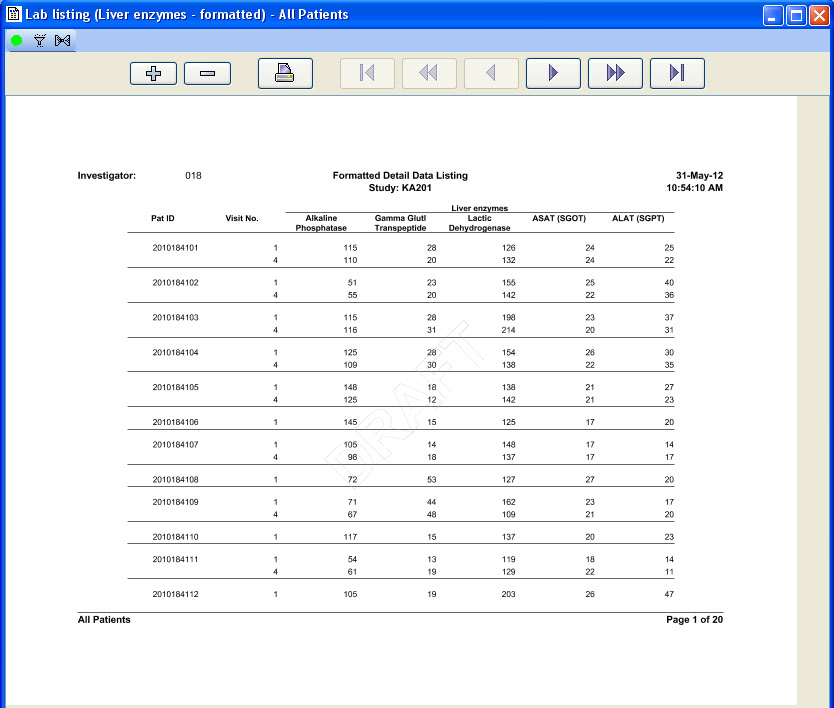
Tabular Patient Profile-Formatted
CRT Listing -Tabular display of patient data for all or selected data by Table/View or by Visit. The Default includes all views/items. The user simply selects which tables are to be included, the desired order, and which items are to be included for each selected table. Automatic row ‘band/wrap’ is supported with export to PDF. This is an alternative to what most companies do by lots of SAS programming. Formatted Patient Profiles can be scheduled to run in batch as well with scheduling server.
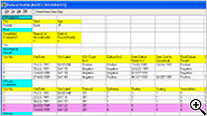
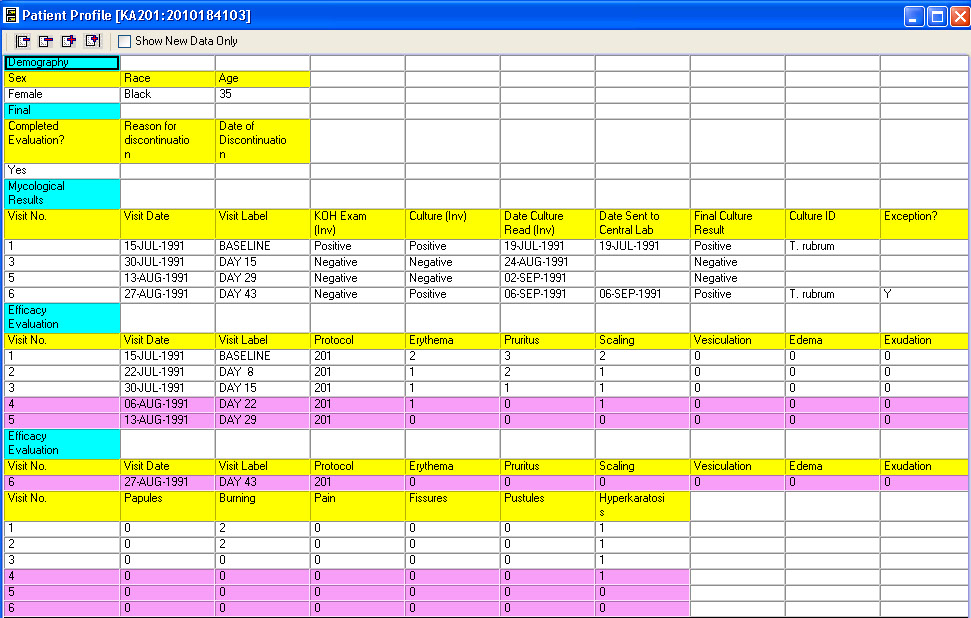
Tabular Patient Profile-Spreadsheet
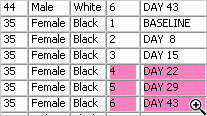
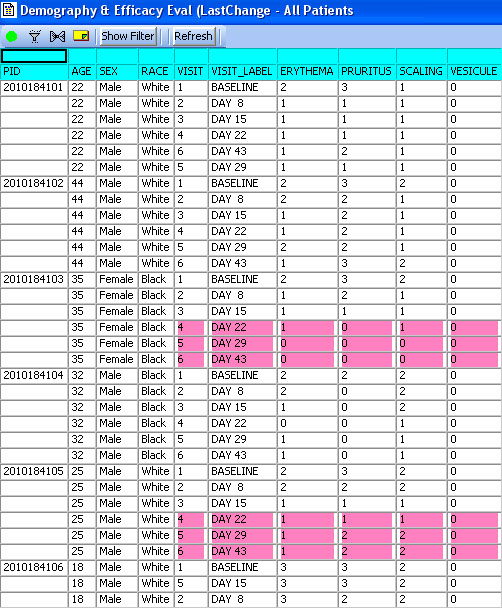
Tabular display of patient data for all or selected data by Table/View or by Visit. The Default includes all views/items with automatic row ‘band/wrap’. Export the profile to Excel, HTML, etc. Also when used with Patient Review tracking the ‘New Data’ highlights rows (purple).
x
x
Patient Identification
This is built-in automatic behavior which requires no setup and is a general capability throughout JReview by clicking one or a number of patient graph points, or report lines to provide patient detail information.
x
DVG/Code Lookup
Built-in awareness of DVGs, code lists, SAS formats are automatically referenced in any report, graph, etc. as Cached and applied in server process.
Notes
Patient, Visit or Data Item level notes can be posted throughout JReview. Keep notes for you, or share with others, regarding your findings or observations during data review.
Alerts
Users can define patient data conditions that they’d like to be notified about whenever the condition becomes true, i.e., if a Serious AE (Adverse Event) is entered, etc., the system sends an email to the user or list of users to be notified.
Output Spec reuse
Report, Graph, Patient profile specifications can be saved at Study, Project, Study Group or Global, and shared widely. If changes are needed, one instance of definitions are updated and automatically available to all studies in ‘scope’ (project, studygroup, global).
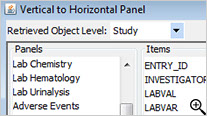
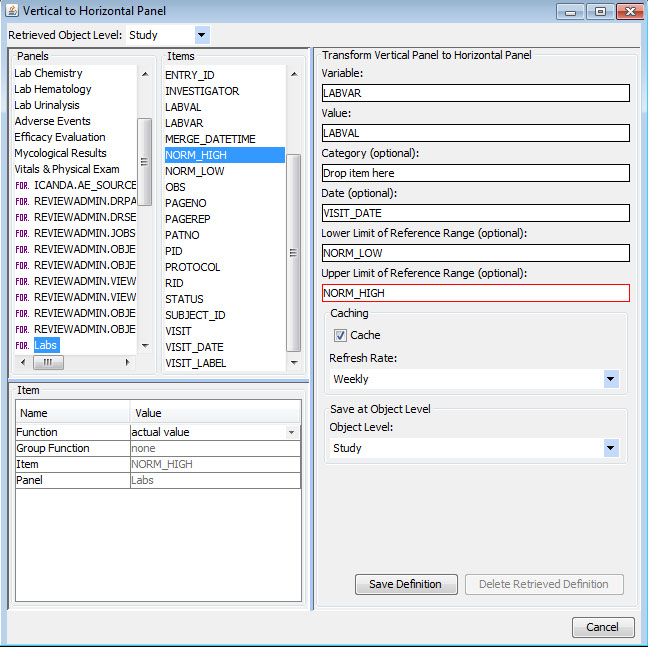
Vertical to Horizontal Panels
Typically (especially in CDISC SDTM), data domains such as labs or vital signs are stored in a vertical structure which is not ideal for visual analytics purposes. Once a panel/domain has been defined as a vertical structure, JReview displays the lab category and lab tests, for example, as if they were normal columns in the domain so users can easily select panel items to define new reporting objects, regardless of the underlying data structure.
Batch Scheduling
Most JReview defined reporting objects for reports, graphs, crosstabs, etc. can be scheduled for later execution in batch as very handy if some reports are retrieving a large amount of data from the database.
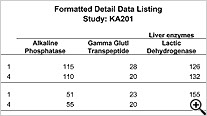
Formatted Reports (PDF)
Detail and Summary nicely formatted PDF reports are designed to look like submission quality data listings with no programming required.
Reports
To the top ↑
Detail Data & Summary listings with
‘New Data’ highlighting
Standard Detail Data and Summary Report listings now optionally display ‘New Data’ highlighting associated with our Patient Review Tracking feature. In these spreadsheet style reports, the user now sees which rows are new or updated since each patient was last reviewed. ** 'New Data' highlighting is unique to JReview, where detail data listing capability is not.
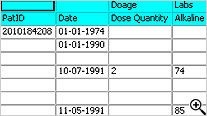
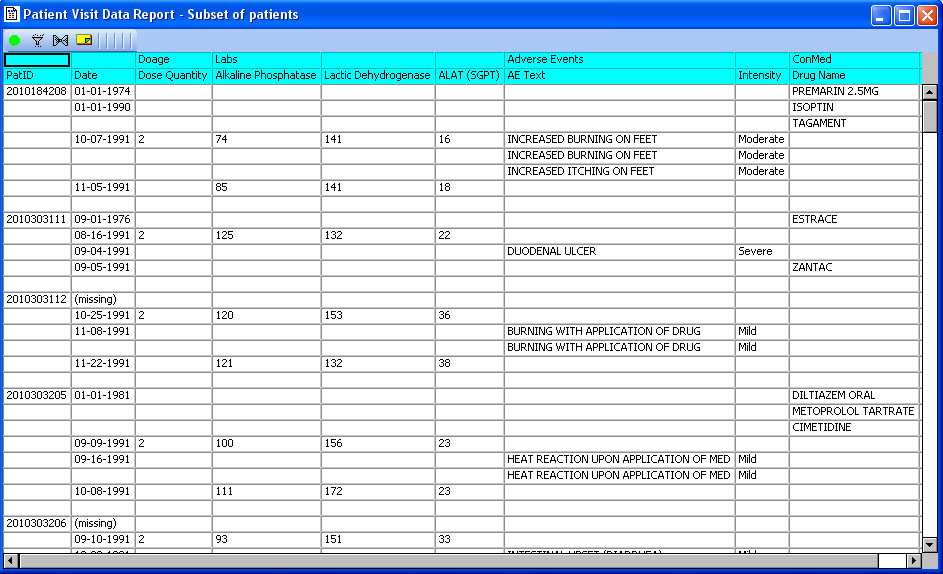
Special ‘Date Merge’ report
Patient Visit Data Report is a special multi-pass date merge report developed with the NCI. No SQL joins for date merge in the JReview client. It is very useful for AE-ConMed display or any other data which is aligned more naturally by observed date (start date, onset date, etc) rather than typical visit joins.
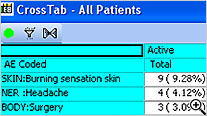
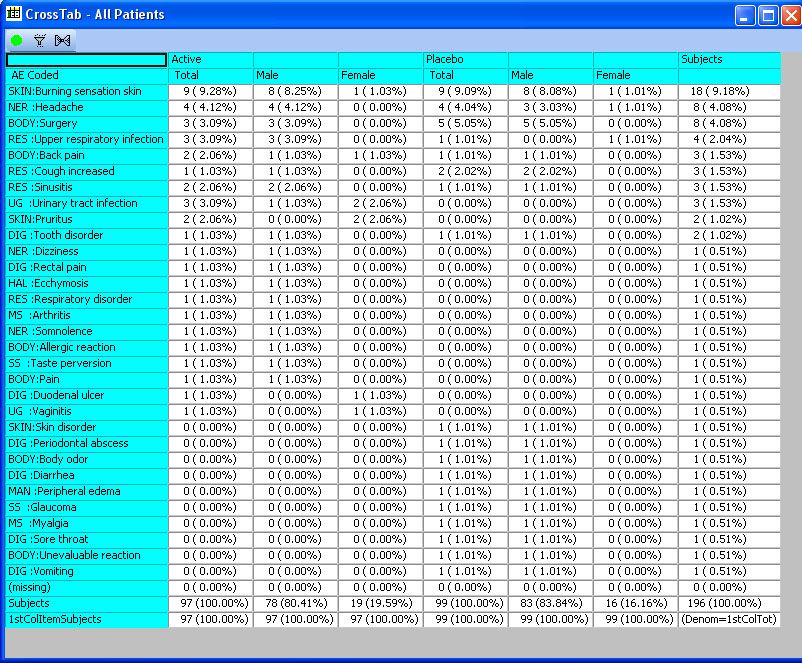
CrossTabs - Nested & ‘Side by Side’
Cross tabulations support both nested and ‘side by side’ display with patient counts in cells, optionally with % of specified denominator (all patients, patients in by Groups, etc). Clicking in a cell identifies the patients and broadcasts a list of patients to any other displayed output. ** CrossTab capability is not unique to JReview, but N (%), denominator selection and patient cell clicking is unique.
x
x
x
To the top ↑
Graphs
x
x

x
x
Clinical Data Management Systems:
Oracle Clinical™
Oracle Clintrial™
Drug Safety Systems:
ARISg™
Oracle ARGUS
Oracle AERS
RDC Systems by:
Veeva CDMS
Medidata Rave™
Clinical Data Warehouse Products:
Oracle LSH
Online Hosting of JReview:
We can now host and administer your system in our JReview Cloud which can pull down your clinical data nightly.
x
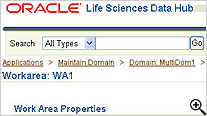
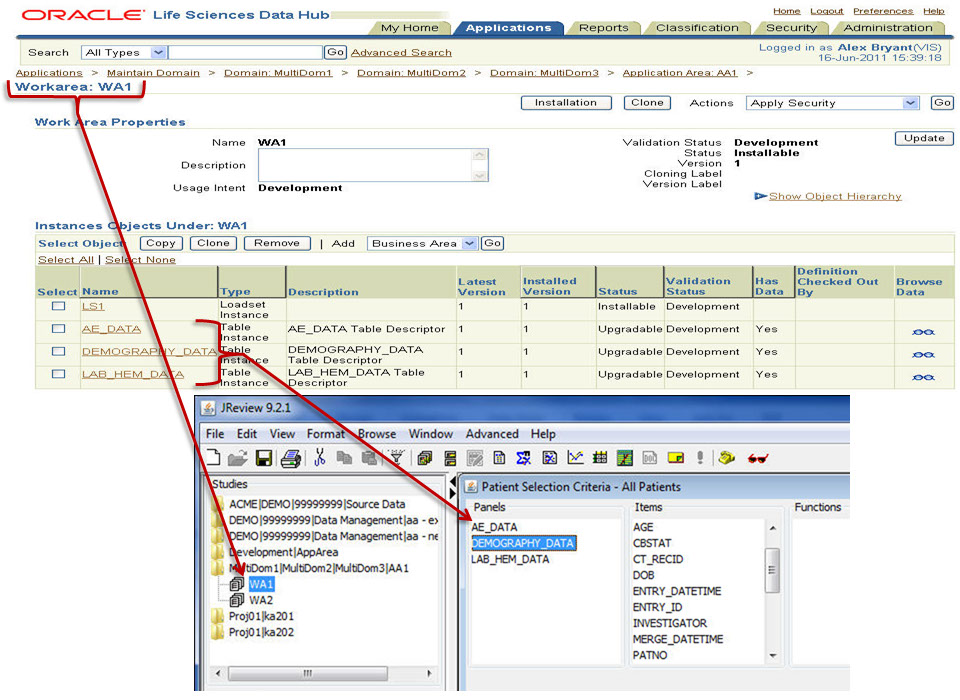
Oracle LSH Connector
JReview now has a built in connector to Oracle LSH, without needing to use the traditional 'adapter' approach and setup. JReview has direct access to the Oracle LSH table instances using the native LSH Security Model. JReview respects LSH Data Blinding, Data Currency, and Snapshot Labels. It also offers the ability to include/exclude LSH hierarchy and data based on JReview specific tags.
x
To the top ↑
Risk Based Monitoring (RBM)
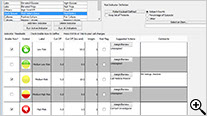
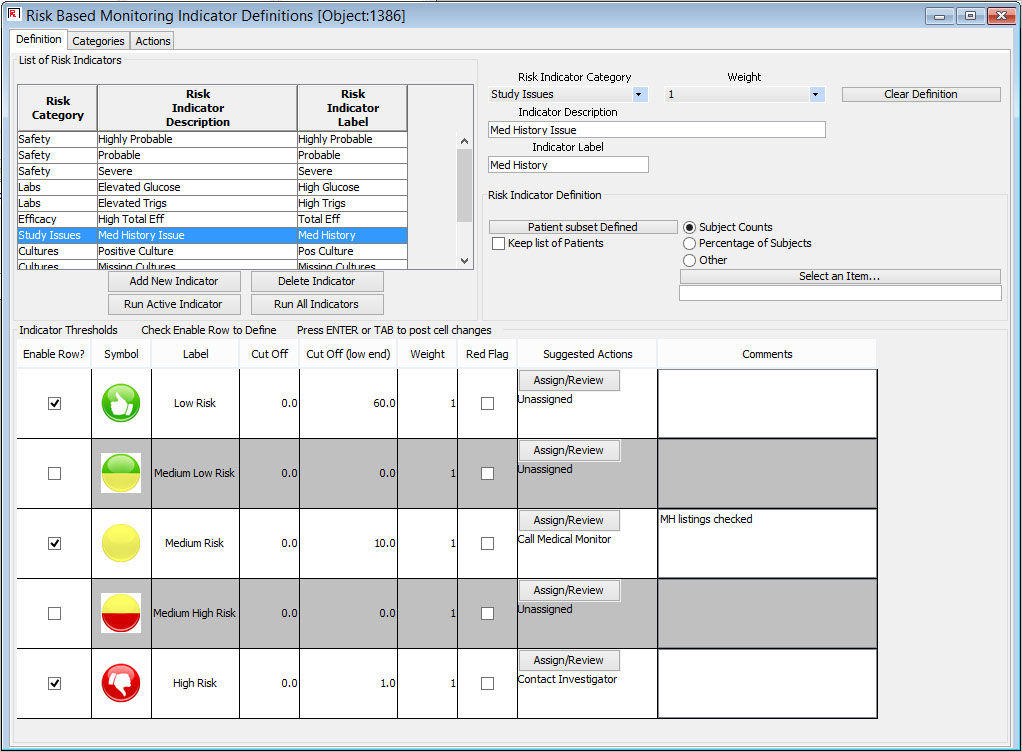
Definition of Key Risk Indicators
Centralized monitoring teams can define risk categories and key risk indicators from all clinical and operational source data available, set thresholds, and specify suggested actions.
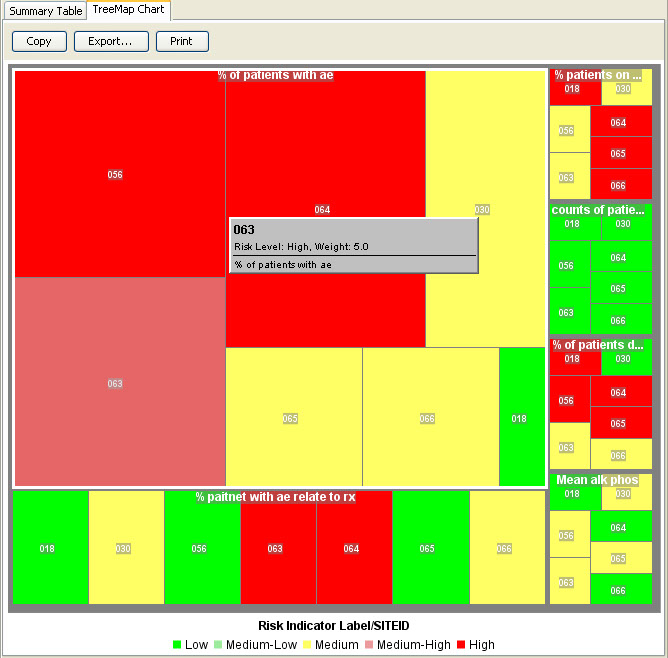
RBM Tree Map
The RBM tree map allows for the inspection of the weightings of selected key risk indicators by site, country, or region.
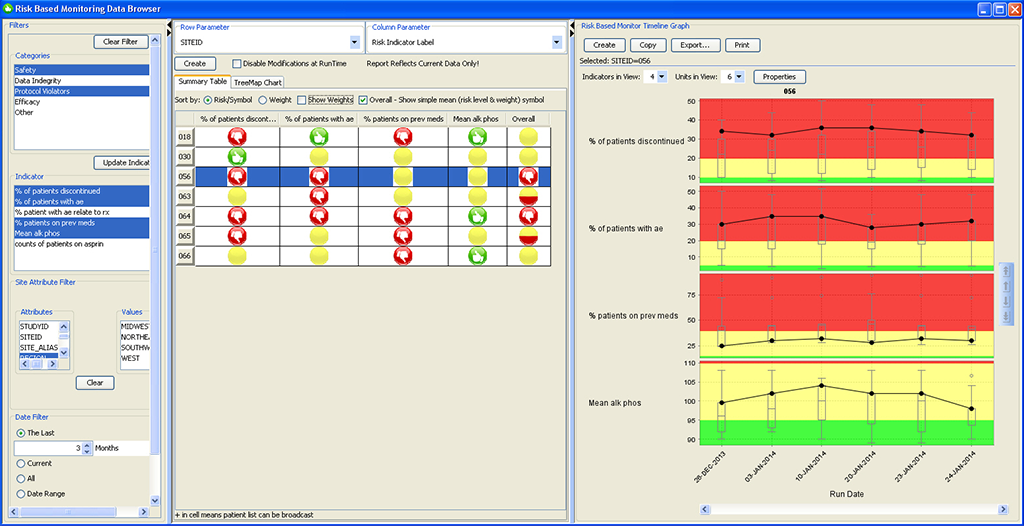
RBM Data Browser
The newly designed JReview RBM Data Browser provides an overview of the timely evolution of multiple key risk indicators by site, country, or region as a summary table as well as a timeline graph (box whisker plot).
x
Clinical Data Sources
To the top ↑
SAS & R Integration
Patient Narratives
To the top ↑
x
x
Study Setup (Admin)
Built-in knowledge of Oracle Clinical system tables, Oracle LSH, Oracle CDC, Clintrial, drug safety systems,etc. plus configurable knowledge of internal data warehouses. The result is that there’s no study setup required as soon as a study is created in your clinical data source then it’s immediately available in JReview.
x
x
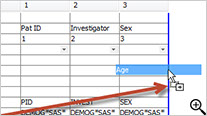
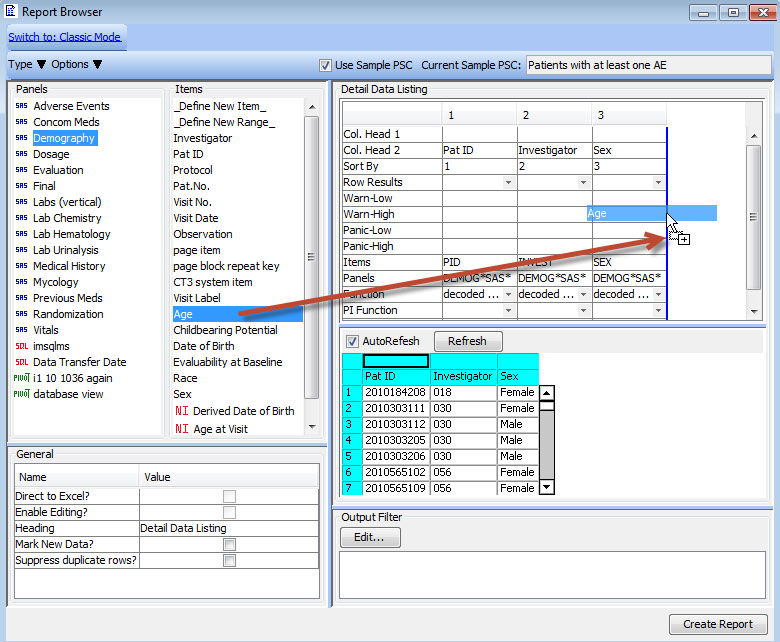
New Drag-and-Drop User Interface
Newly designed drag-and-drop user interface added to Reports, CrossTabs and Graphs provides immediate preview of output results for further refinement before saving and sharing the object definitions.
This interactive preview mode lets you see the report as you add columns - previewing the results on a subset of data in real time.
Copyright © 2025 Integrated Clinical Systems, Inc. All rights reserved.
JReview® is a registered trademark of Integrated Clinical Systems, Inc.